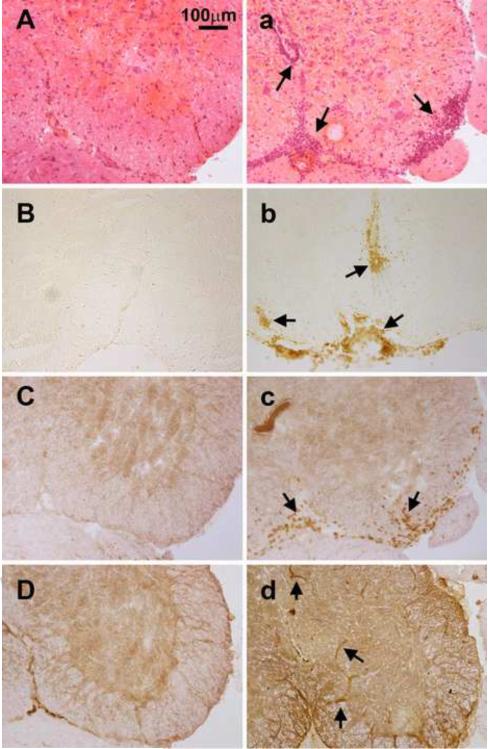
Figure 5.
Representative microphotographs of H&E stained and immunohistochemically labeled spinal cord sections at the onset of EAE. A–D are from eIL-1R1 kd animals, and a–d WT FVB animals. A and a: H&E; B and b: CD45, C and c: CD3; D and d: VCAM-1. Arrows point to areas of perivascular cuffing and spinal inflammation in Fig. 5a, CD45+ infiltrating leukocytes in Fig. 5b, CD3+ infiltrating T cells in Fig. 5c, and VCAM positive blood vessels in Figs. 5d and 5D.

