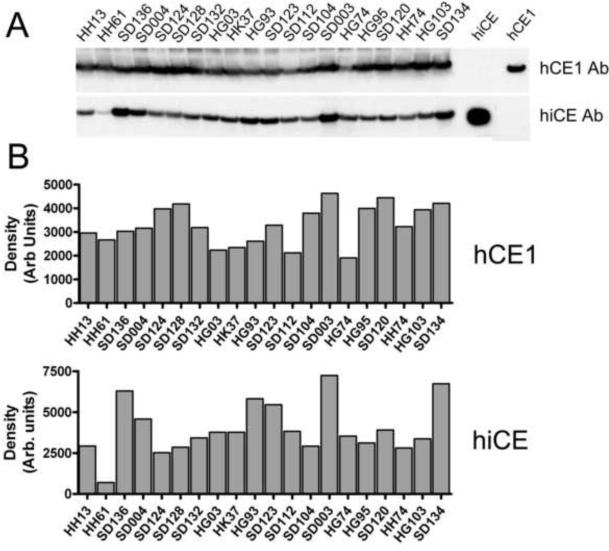
Figure 1.
Analysis of CE expression in human liver microsomes
A – Western analysis of hCE1 and hiCE expression in human liver microsomal extracts. Purified proteins (50ng of each) were used as positive controls and are indicated on the right hand side of the image.
B – Densitometric quantitation of the western analyses depicted in panel A.

