
Figure 2.
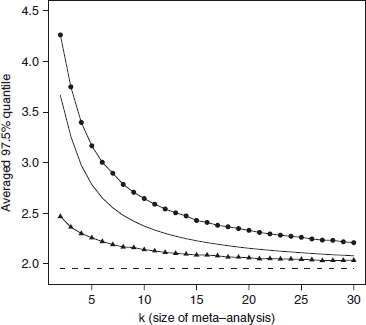
97.5 per cent quantiles of M from the simulation studies. Triangles show the results for the first scenario, where within-study variances lie in the interval [0.06,0.6]; circles show the results for the second scenario, where the within-study variances lie in the interval [0.0009,0.6]. The corresponding solid curves show the fitted regressions and the other solid curve follows the quantiles from the quantile approximation method. The dashed line shows the standard normal quantile, for comparison.