
Figure 1.
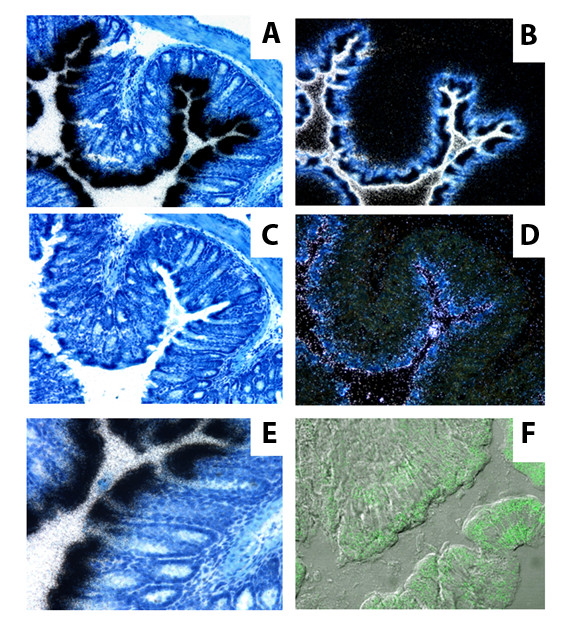
Intestinal SAA expression and secretion. SAA1/2 RNA, represented by the black signal in A and E, or the white signal in the counter-stained image B, was readily detectable in cross-sections of colonic epithelia (A, B), and was mainly located at the villous tips (E). SAA3 message showed similar distribution, but was much weaker (black signal in C, white in counter-stained image D). SAA immunostaining (green signal) showed a more diffuse pattern than SAA RNA, with SAA protein expressed along the crypt-villus axis (F), perhaps reflecting secretion of SAA by intestinal epithelial cells into the apical and basolateral milieu. A,C and E represent bright-field images, B and D dark-field images.