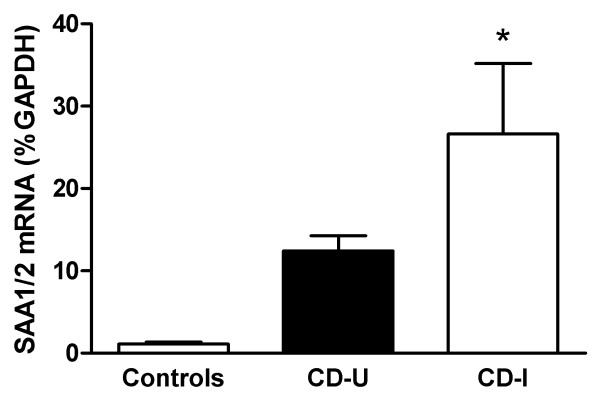
Figure 6.
SAA expression in human biopsies. RNA was isolated from biopsies obtained from inflamed ileal and colonic biopsies from CD patients (CD-I ("involved")) and from uninvolved areas ("CD-U"), as well as from control patients (n = 5). Shown is the average of SAA1/2 expression ± S.D., expressed as% GAPDH. The differences between CD-I and controls were statistically significant (ANOVA; P < 0.05).

