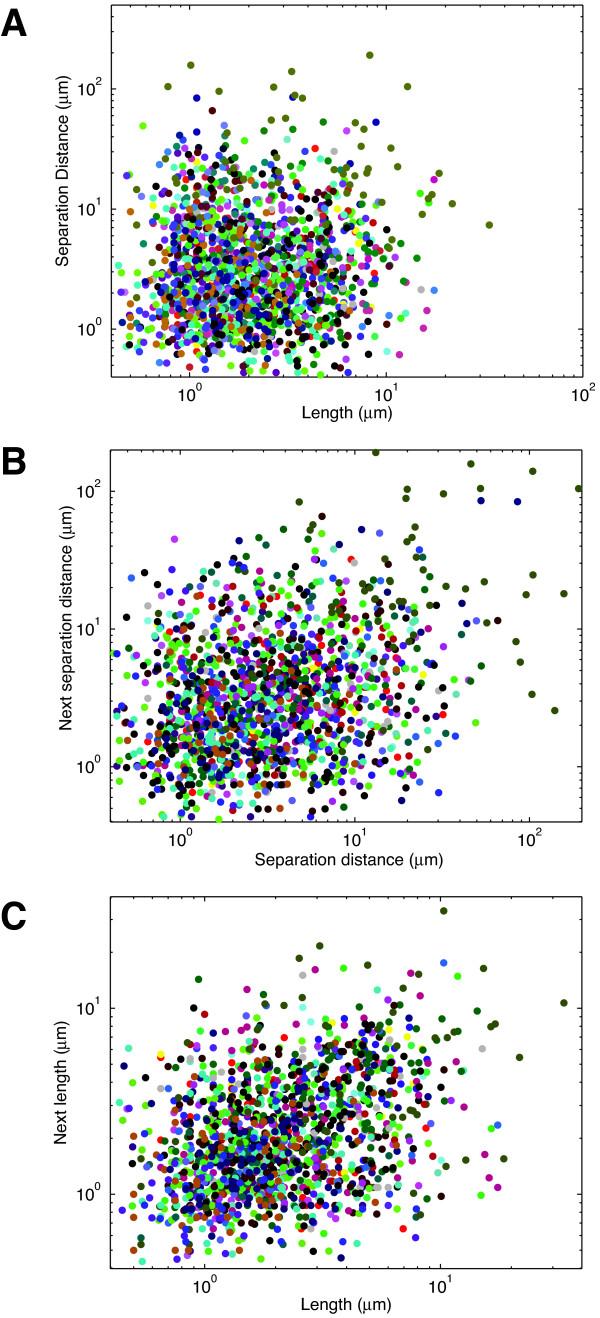
Figure 4.
Filopodia length and distance separation are independent. (A) Scatter plot of filopodia lengths against the neighboring distances shows no correlation. Identically coloured data points represent measurements from the same cell. (B) Scatter plot of the distances between filopodia versus the distances between the next filopodia in a clockwise direction around the edge of the cell. (C) Scatter plot of the lengths of filopodia versus the lengths of the next filopodia in a clockwise direction around the edge of the cell.

