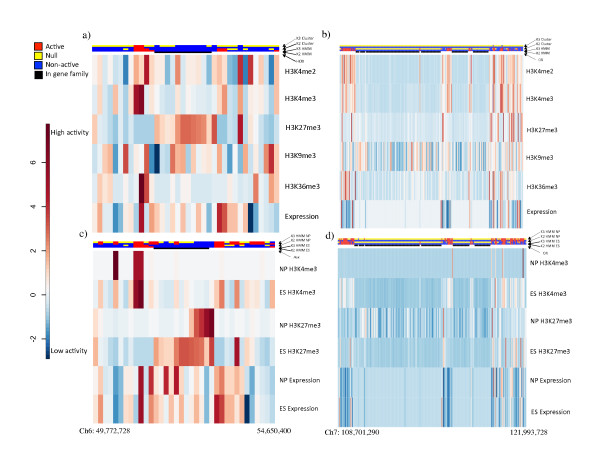
Figure 6.
Heatmaps of known gene clusters. The 35 gene region on Ch6 from Npy to 2410066E13Rik (49,772,728 to 54,650,400) as depictured as a heatmap of histone modification and gene expression for (a) the ES cell line and (c) ES and NP cell lines. The 250 gene region on Ch7 from Art2a to Insc (108,701,290-121,993,728) as depictured as a heatmap of histone modification and gene expression for (b) the ES cell line and (d) ES and NP cell lines. For all figures on the left (a and c), cluster state assignment is given in the first and second tracks and HMM state assignments are in the third and fourth tracks (red for active state, blue for non-active state, yellow for null state). For figures on the right (b and d), NP HMM state assignment is given in the first and second tracks and ES HMM state assignments are in the third and fourth tracks. Whether (black) or not (white) a gene is a respective gene cluster in shown in the bottom track in all figures.

