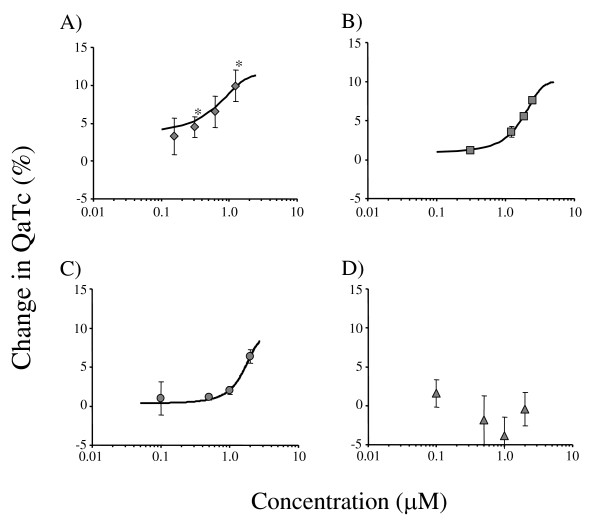
Figure 1.
Relationships between QaTc changes and concentrations of quinidine (A), quinine (B), halofantrine (C), and mefloquine (D) in the isolated perfused guinea pig heart system. Each bar represents the mean ± SEM (n = 3 - 4). *Statistically significant compared with the same concentrations of quinine (p < 0.05).

