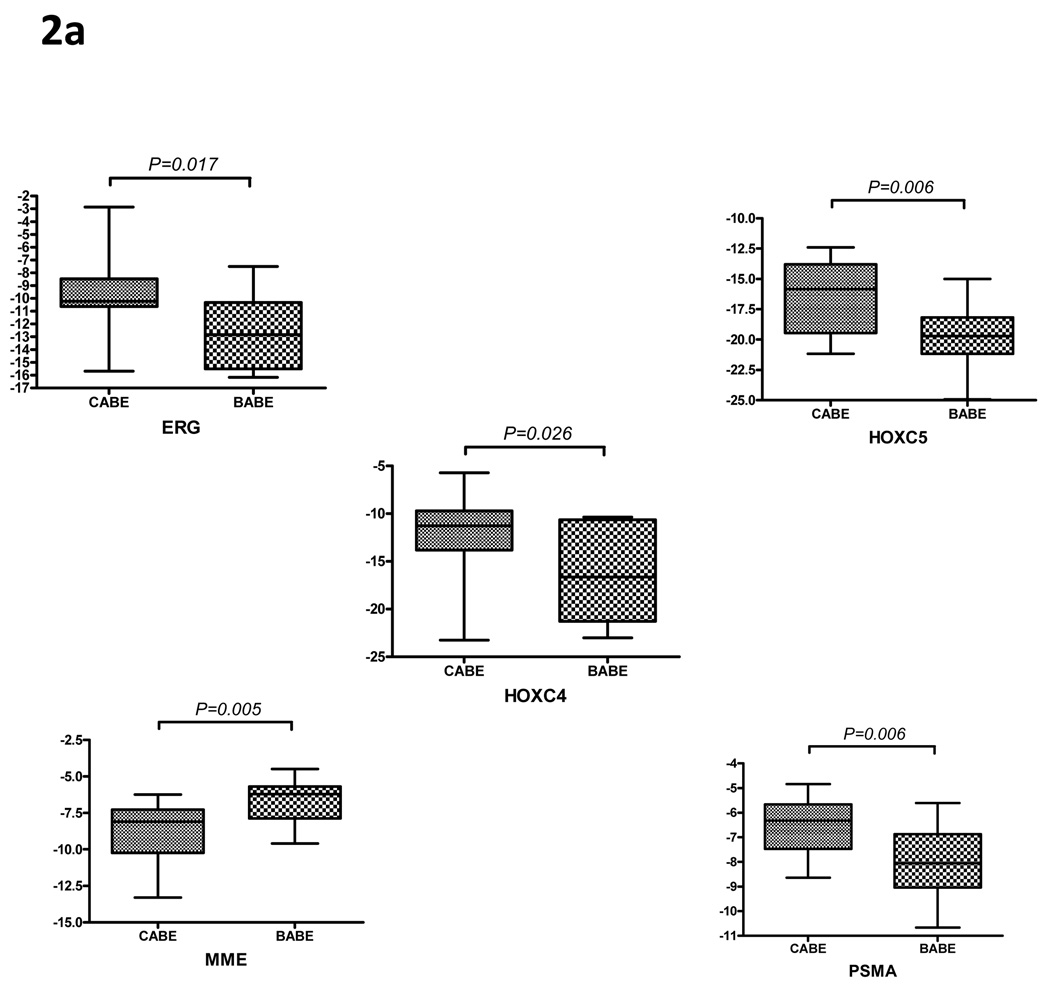
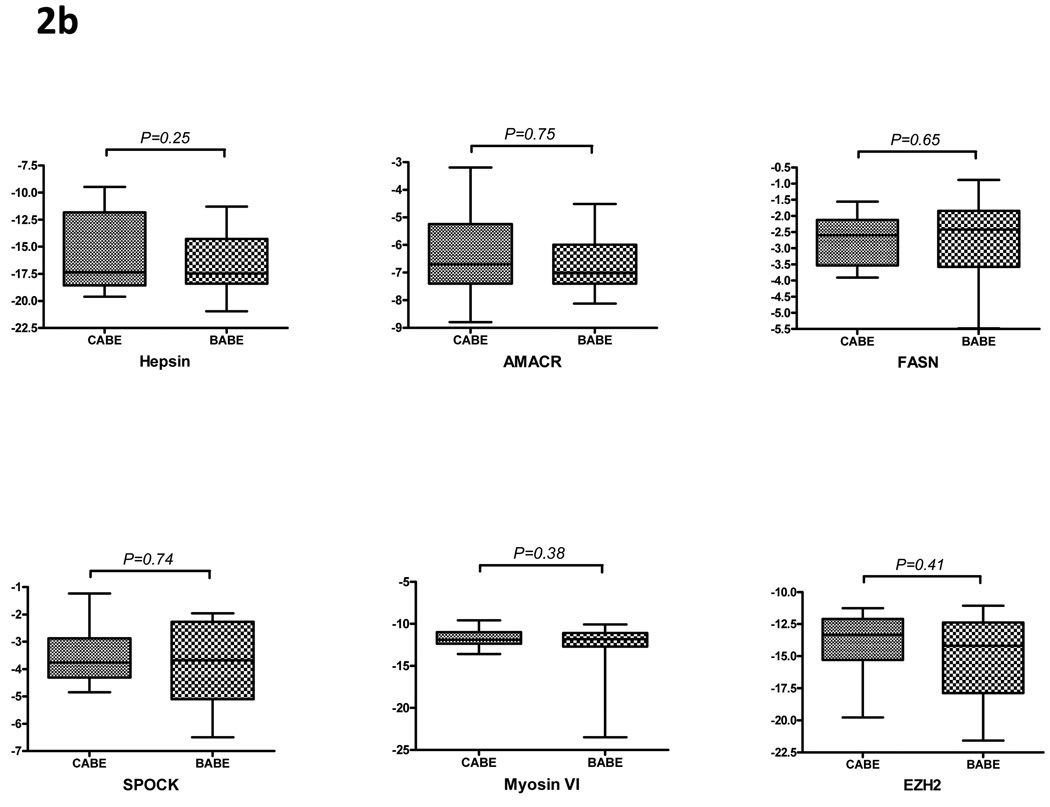
Figure 2. QPCR of prostate cancer genes in BABE versus CABE patients.
Quantitative reverse transcription polymerase chain reaction was used to examine the expression of (A) prostate cancer genes which have altered expression in CABE versus BABE patients based on the microarray data and (B) prostate cancer associated genes not altered between the two groups on microarray. Cycle threshold, denoted on the y-axis, is detected cycle number relative to housekeeping gene RPL13A(dCT). The data is expressed in the graphs as −1dCT to visually reflect the differences in expression between the two groups, thus in this format lower mean level corresponds to decreased gene expression.


