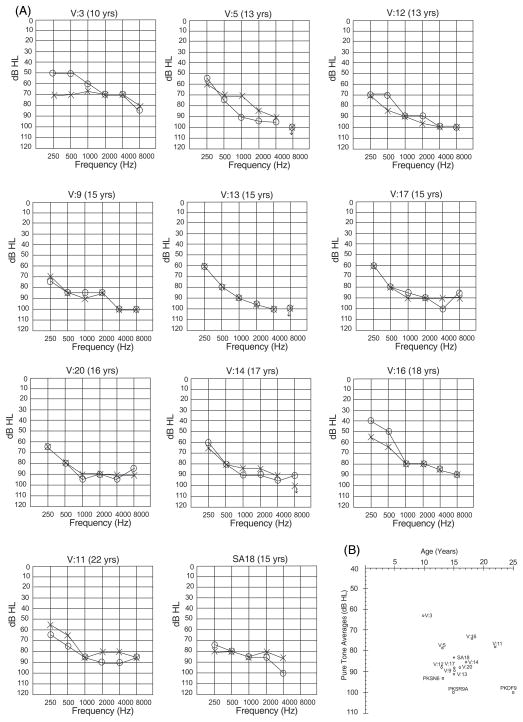
Figure 2.
a) Audiograms for all affected family members of family HLRB5 and SA18. Age at time of first audiometry is indicated on top of each audiogram. “o” indicates air conduction for right ear, while “x” indicates air conduction for left ear
b) Average thresholds at pure tones (500, 1000, 2000 and 4000 Hz) for the better hearing ears in family HLRB5 (circles), individual SA18 (triangle) and previously published families (squares) with mutations in CLDN14. The degree of hearing loss is different across and within families with mutations in CLDN14. All families have the same mutation, except for family PKSN6.

