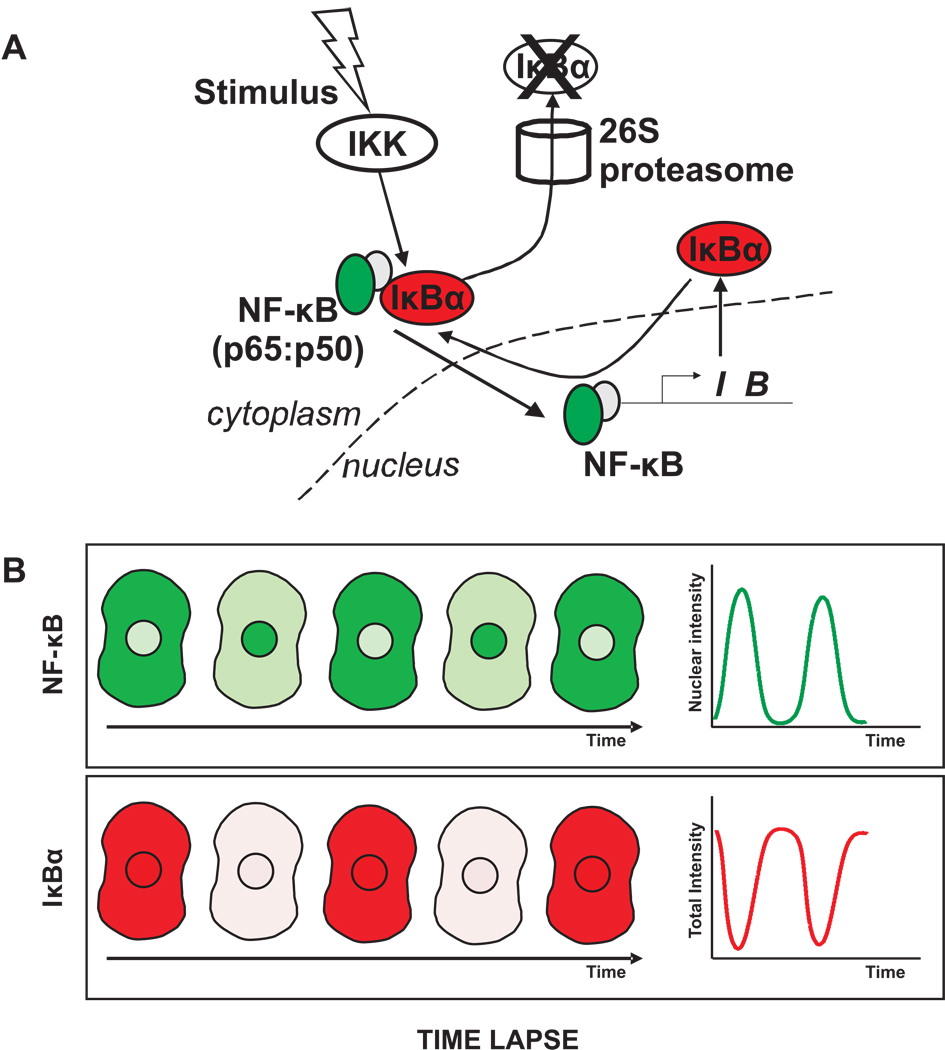
Figure 4. Measuring protein levels by time lapse imaging.
Time lapse imaging could be used to follow changes in concentration and localization of NF-κB and IκBα within individual cells. A. NF-κB could be tagged with GFP (green) and IκBα with mCherry (red). B. Following stimulation of the pathway, fluorescence images in red and green could be acquired at a series of time points. Due to the IKK-induced degradation and re-synthesis of IκBα proteins, the levels of IκBα are expected to decrease and increase, while the nuclear level of NF-κB is expected to concomitantly increase and decrease. These changes could be quantified by measuring NF-κB fluorescence intensities in the nucleus and IκBα intensities in the whole cell.

