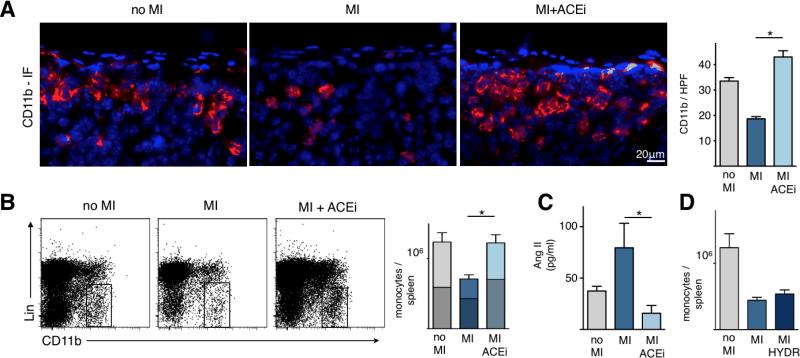
Figure 1. ACE inhibition abolishes the release of splenic monocytes in acute MI.
A. Splenic sections stained with CD11b-specific antibodies (red) and 4′,6′-diamidino-2-phenylindole (DAPI) (blue) showing the subcapsular red pulp. Right panel shows enumeration of CD11b+ cells in the subcapsular red pulp.
B. Flow cytometric analysis of spleens. Rectangle indicates monocyte gate, Lin: lineage markers. Bars are divided to display contribution of monocyte subsets (upper part / lighter color encodes Ly-6Chigh monocytes, whereas the lower / darker part shows Ly-6Clow monocytes).
C. Serum levels of Angiotensin II measured by ELISA.
D. Total number of monocytes in the spleen in control mice (no MI) or 1 day after MI with and without Hydralazine (HYDR) treatment, a direct vasodilator. Mean ± SEM; * p < 0.05.

