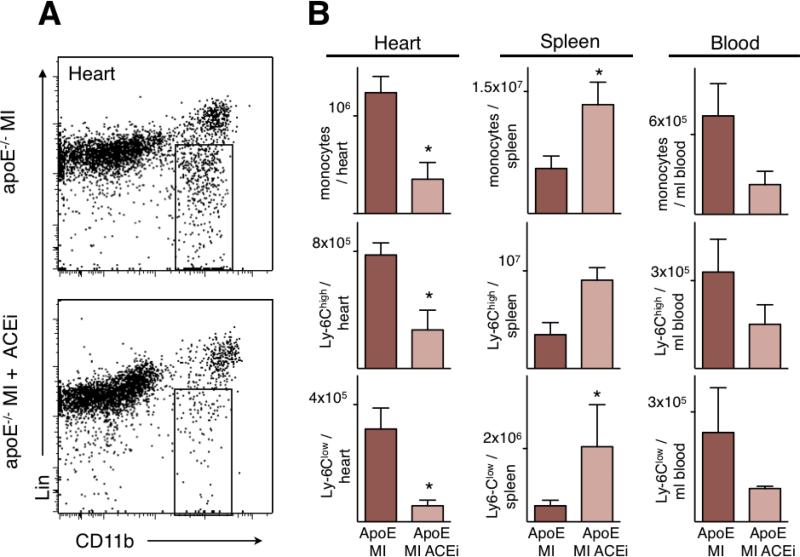
Figure 5. Impact of Enalapril on monocyte flux in apoE-/- mice.
A. Representative flow cytometry dot plots of infarct tissue from apoE-/- mice 1 day after MI. The gate shows CD11b positive lineage negative monocytes and macrophages. Lin: Lineage markers.
B. Quantitation of monocytes and their subsets by flow cytometry in heart, spleen and blood of apoE-/- mice 1 day after MI. Mean ± SEM; * p < 0.05.

