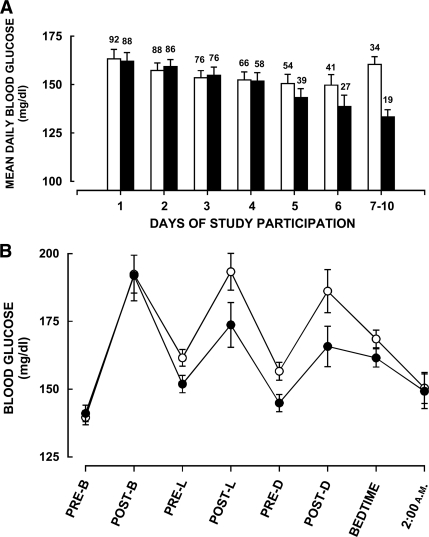
Figure 1.
A: Time course of mean daily blood glucose concentrations (premeal and bedtime blood glucose concentrations) in patients treated with glulisine (■) or regular insulin (□) in combination with glargine. Numbers on top of each bar indicate the number of subjects in each group. Data are means ± SEM. Overall ANOVA, P < 0.0001. B: Mean blood glucose concentrations prebreakfast (PRE-B), 2-h postbreakfast (POST-B), prelunch (PRE-L), 2-h postlunch (POST-L), predinner (PRE-D), 2-h postdinner (POST-D), at bedtime, and at 2:00 a.m. in patients treated with glulisine (●) or regular insulin (○) in combination with glargine during the entire study. Means of prelunch, predinner, and bedtime blood glucose concentrations (P < 0.0003) and 2-h postprandial blood glucose concentrations (P < 0.03), largely determined by the short-acting insulin, were significantly lower in the glulisine group than in the regular insulin group. In contrast, fasting and 2:00 a.m. blood glucose concentrations, largely determined by glargine, were comparable in both groups (both P > 0.7). Data are means ± SEM.

