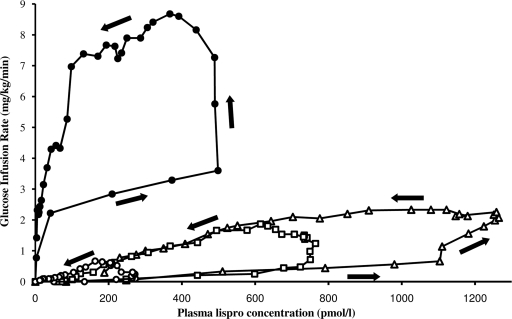
Figure 3.
Plot of mean glucose infusion rate as a function of insulin plasma concentrations in healthy subjects receiving subcutaneously 10 units of lispro (●) and in obese subjects with type 2 diabetes receiving 10 units (○), 30 units (□), and 50 units (▵) of lispro. Data points are connected in chronological order; as depicted by the arrows, the resulting relationship denotes a counterclockwise hysteresis.

