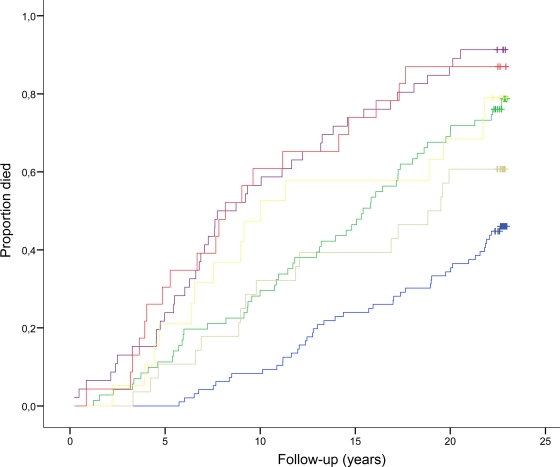
Figure 3.
Kaplan-Meier curves of all-cause mortality in 283 type 2 diabetic patients according to UAER and median plasma OPG (1,963 pg/ml). Patients with normoalbuminuria and OPG <1,963 pg/ml (blue line) or OPG >1,963 pg/ml (green line); patients with microalbuminuria and OPG <1,963 pg/ml (gray line) or OPG >1,963 pg/ml (purple line); and patients with macroalbuminuria and OPG <1,963 pg/ml (yellow line) or OPG >1,963 pg/ml (red line). Log-rank test for overall difference, P < 0.0001.

