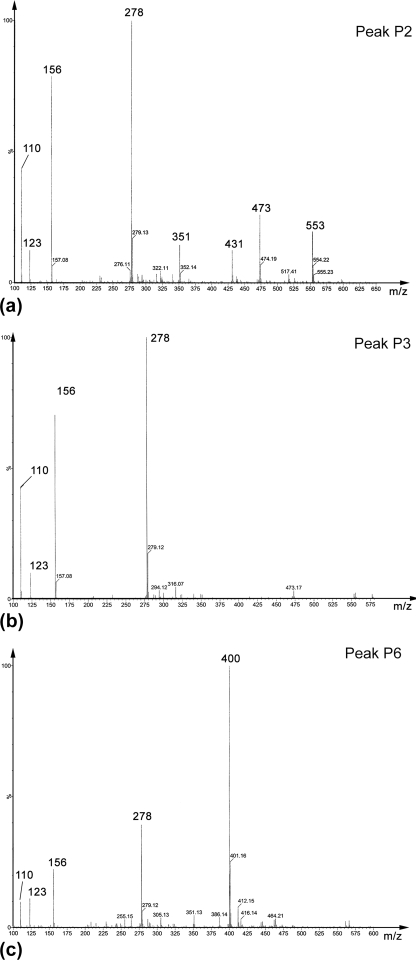
FIGURE 2.
ESI-MS spectra of HPLC peaks. a, P2; b, P3; and c, P6. Peak 2 is a mixture of most catecholic compounds isolated by phenylboronate affinity chromatography, whereas P4 and P6 contain nearly pure compounds with m/z = 278 and 400, respectively. The smaller peaks in b and c arise from fragmentation occurring at low acceleration voltage during ESI-MS (i.e. m/z = 278 is a fragment ion from m/z = 400; see Fig. 3).

