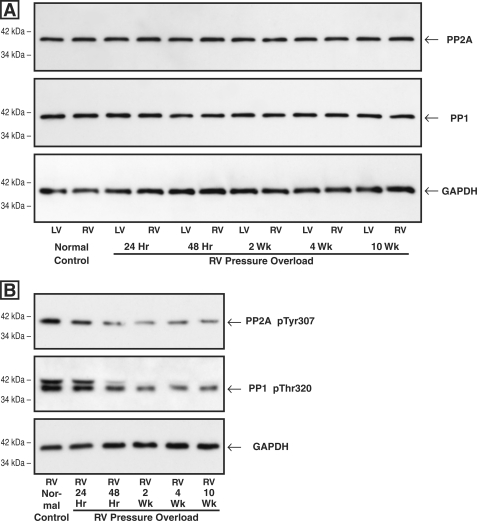
FIGURE 4.
Myocardial levels of total and inactive PP2A and PP1 after RV pressure overloading. Myocardial homogenates used for all of these blots were prepared from the same-animal RVs and LVs at the indicated times after hypertrophy induction via PAB. A, levels of total PP2A and PP1. The antibodies used for these blots were a monoclonal antibody to the catalytic subunit of PP2A (clone 1D6; Upstate Biotech), a monoclonal antibody to PP1 (clone E-9; Santa Cruz Biotechnology), and, as the loading control, a monoclonal antibody to GAPDH (clone 6C5; Upstate Biotech). The densitometric ratio of RV/LV PP2A and PP1 signals in this and two other sets of immunoblots did not differ more than 10% from unity at any time point. B, levels of inactive PP2A and PP1. The antibodies used for these blots were a phosphopeptide antibody to inactive PP2A Tyr(P)-307 (clone E155; Epitomics), a phosphopeptide antibody to inactive PP1 Thr(P)-320 (clone EP1512Y; Epitomics), and, as the loading control, a monoclonal antibody to GAPDH (clone 6C5; Upstate Biotech). In this and one other PP2A Tyr(P)-307 blot, the average ratio of pressure-overloaded RV/control RV was 0.77 for the 24-h RV, 0.47 for the 48-h RV, 0.36 for the 2-week RV, 0.50 for the 4-week RV, and 0.39 for the 10-week RV; in this and one other PP1 Thr(P)-320 blot, the average ratio of pressure-overloaded RV/control RV was 0.81 for the 24-h RV, 0.60 for the 48-h RV, 0.46 for the 2-week RV, 0.43 for the 4-week RV, and 0.45 for the 10-week RV.

