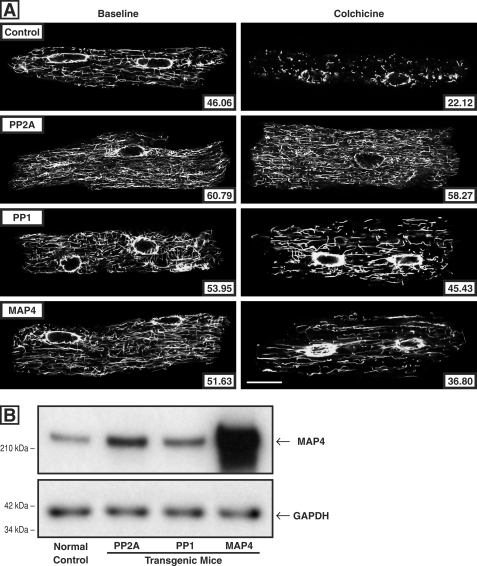
FIGURE 8.
Cardiomyocyte microtubule network density and stability. A, confocal micrographs of cardiomyocytes isolated from the hearts of control and colchicine-treated mice. For these micrographs, prepared using a monoclonal anti-β-tubulin antibody (clone DM-1B; Abcam), the left column shows cardiomyocytes isolated from vehicle-treated mice, and the right column shows cardiomyocytes isolated from colchicine-treated mice (0.50 mg/kg given intraperitoneally 4 h before sacrifice). The mice were either normal controls or had cardiac-restricted overexpression of PP2Acα, PP1cα, or MAP4. The number inset in each micrograph gives the mean pixel intensity (white level) within the boundary of each cardiomyocyte. Scale bar, 20 μm. B, level of cardiac MAP4 protein. The MAP4 immunoblot, prepared using our anti-MAP4 antibody (24), and its loading control, prepared using an anti-GAPDH antibody (clone 6C5; Upstate Biotech), show the relative level of MAP4 protein in the myocardium from WT control mice and mice with cardiac-restricted overexpression of PP2A, PP1, or MAP4. The mean densitometric ratios for three measurements were: PP2A/control, 3.26 ± 0.05; PP1/control, 2.32 ± 0.02; and MAP4/control, 21.10 ± 0.78.

