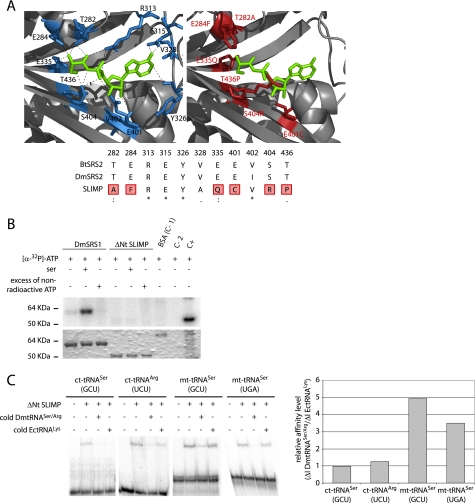
FIGURE 2.
SLIMP structural analyses. A, active site structural analysis. B. taurus mitochondrial SRS structure (1WLE, left) is shown with the seryl-adenylate in green. Residues that contact the intermediate are depicted in blue. The SLIMP catalytic core three-dimensional model is shown to the right. The residues in red correspond to non-conserved residues that would disrupt the interaction between SRS substrates and SLIMP. The alignment shows that all the interacting residues from B. taurus are conserved in DmSRS2, whereas 6 over 11 of these are not conserved in SLIMP. B, ATP photocross-linking assay. ATP binding ability was assessed for DmSRS1 and ΔNt SLIMP. The upper panel shows the signal from [α-32P]ATP bound to the tested proteins, and the lower panel shows the Coomassie Blue-stained SDS-PAGE. Serine was added in some reactions to test whether it would increase the affinity of SLIMP for ATP. An excess of non-radioactive ATP was used to ensure the specificity of the interactions. DmSRS1 binds ATP specifically, but ΔNt SLIMP does not. Controls are BSA (negative control (C-1)), protein extracts (positive control (C+)), and buffer (negative control (C-2)). C, tRNA binding by ΔNt SLIMP measured by EMSA. The two mitochondrial tRNASer isoacceptors and two cytosolic tRNAs (tRNASer (GCU) and tRNAArg (UCU)) from D. melanogaster were tested. Competition assays were performed adding non-radiolabeled DmtRNASer/Arg or a heterologous tRNA (tRNALys from E. coli). Affinity values are represented as ΔI DmtRNASer/Arg/ΔI EctRNALys, where ΔI DmtRNASer/Arg is (signal intensity when adding radiolabeled DmtRNASer/Arg − signal intensity when adding 10× non-radiolabeled DmtRNASer/Arg), and ΔI EctRNALys is (signal intensity when adding radiolabeled DmtRNASer/Arg − intensity when adding 10× non-radiolabeled EctRNALys). Ratios ≤1 indicate nonspecific interactions. The values obtained for the two mitochondrial DmtRNASer (GCU and UGA) tested are 4.95 and 3.50, respectively, whereas the values for the cytosolic DmtRNASer (GCU) and DmtRNAArg (UCU) are similar to 1 (0.98 and 1.26, respectively).

