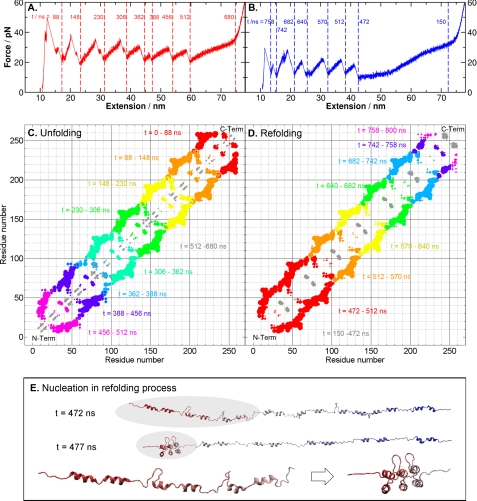
FIGURE 2.
Unfolding and refolding sequences of NI6C. A, simulated complete unfolding force extension traces of NI6C, with timestamps marked between each major force peak, indicating the breaking of a tertiary structure. pN, piconewtons. B, simulated complete refolding force extension traces of NI6C, with timestamps. C, changes in the distance between native contacts during the complete unfolding process, with color code from red to gray representing different time spans defined in A. For each contact, a varying size of dot is used. The size (S) of a dot is proportional to the change in the distance between the residues of an original native contact within a certain time span, i.e. S = c(r(t2) − r(t1)), where r(t) is the residual distance at time t, and c is a scaling constant. This change in contact distance clearly shows that the breakup of native contacts during the mechanical unfolding proceeded from the C to N terminus. The gray regions represent the unfolding of local α-helices (H1 and H2), corresponding to the plateau between 512 and 680 ns in A. D, changes in native contact distance during the complete refolding process, with color-coded time spans. From t = 150 to 472 ns, local structures were formed (shown by the gray regions), followed by the simultaneous folding of three repeats at the N terminus. This nucleation event produced the first force peak that appeared between t = 472 and 512 ns in B. E, snapshots of the NI6C structures before and after the nucleation event with timestamps. The zoomed inset shows the conformational change in the nucleation region (shaded) at t = 472 and 477 ns. Three N-terminal repeats folded within 5 ns and formed a nucleation core, which facilitated the folding of the rest of the polypeptide chain.

