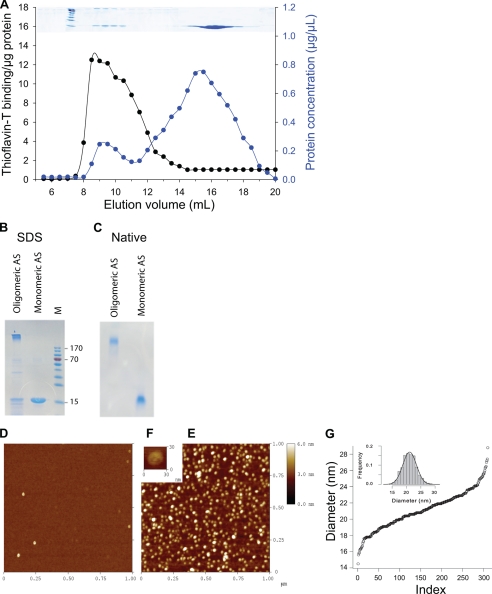
FIGURE 2.
Characterization of recombinant human α-synuclein (AS). A, shown is size exclusion chromatography of recombinant α-synuclein from the resolubilized amonium sulfate pellet of the heat-treated crude extract shown in lane 3 of Fig. 1, A and B. Elution profile from the Superose 6 column shows the protein concentration profile according to the absorbance at 280 nm (blue circles) and the Th-T fluorescence profile (black circles). Above the inset, Coomassie stain of the corresponding eluted fractions after separation on 12% SDS-PAGE is shown. B and C, two fractions were pooled from 15–18 ml as monomeric AS and from 7.5–11 ml as oligomeric AS, concentrated, and further separated by SDS-PAGE (B) or native-PAGE (C) and Coomassie-stained. Standard molecular masses (M) in kDa are indicated for the SDS-gel. D–F, shown are atomic force microscopy morphological studies of AS monomers and AS oligomers, as in B and C. Atomic force microscopy images (1 μm × 1 μm) of AS monomers (D) and AS oligomers (E) are shown. At higher magnitude, AS oligomers present a globular flattened-shape structure (F). G, shown is cumulative function of the diameter distribution of the AS oligomers with a mean size of 21.1 nm and a S.D. s = 2.4 nm. Inset, shown is s histogram of the distribution superimposed with a Gaussian (mean = 21.1 nm, s = 2.4 nm).

