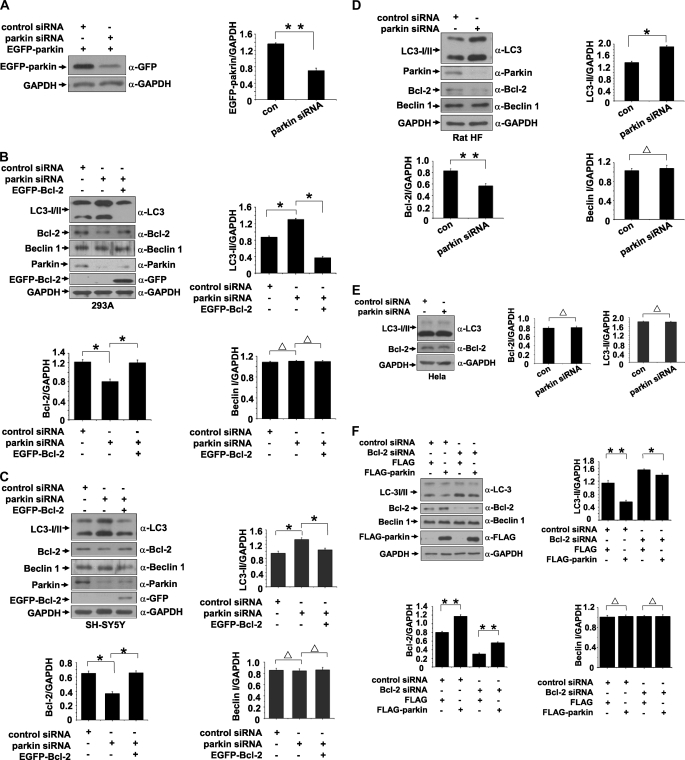
FIGURE 7.
Increase of autophagy level by knockdown of parkin. A, RNA oligonucleotides against parkin (parkin siRNA) repress parkin expression effectively. The band density of EGFP-Bcl-2 relative to that of GAPDH was shown. The values are the means ± S.E. from three independent experiments. **, p < 0.01, one-way ANOVA. B and C, knockdown of parkin enhances autophagy. 293 or SH-SY5Y cells were transfected with siRNAs against parkin or a combination of siRNAs against parkin and EGFP-Bcl-2. Negative control was also set by transfection of control siRNAs. Seventy-two hours after transfection, the total cell lysates were subjected to immunoblot analysis with antibodies as indicated. The band densities of LC3-II, Bcl-2, and Beclin 1 relative to that of GAPDH were shown. The values are the means ± S.E. from three independent experiments. **, p < 0.01; *, p < 0.05; Δ, p > 0.05, one-way ANOVA. D, knockdown of parkin enhances autophagy in primary cultured neuronal cells from rat HF. Cultured neuronal cells were transfected with siRNAs against parkin or negative control. Seventy-two hours after transfection, the total cell lysates were subjected to immunoblot analysis with antibodies as indicated. The band densities of LC3-II, Bcl-2, and Beclin 1 relative to that of GAPDH were shown. The values are the means ± S.E. from three independent experiments. **, p < 0.01; *, p < 0.05; Δ, p > 0.05, one-way ANOVA. E, HeLa cells were transfected with siRNAs against parkin or control siRNAs. The total cell lysates were collected 72 h after transfection and then subjected to immunoblot analysis with antibodies as indicated. The band densities of LC3-II or Beclin 1 relative to that of GAPDH were shown. The values are the means ± S.E. from three independent experiments. Δ, p > 0.05, one-way ANOVA. F, knockdown of Bcl-2 attenuates parkin-induced down-regulation of autophagy. 293 cells were transfected with the RNA oligonucleotides against Bcl-2 (Bcl-2 siRNA) or control siRNA. The cells were then transfected with FLAG or FLAG-parkin. The total cell lysates were collected 72 h after transfection and then subjected to immunoblot analysis with antibodies as indicated. The band densities of LC3-II, Bcl-2, and Beclin 1 relative to that of GAPDH were shown. The values are the means ± S.E. from three independent experiments. **, p < 0.01; *, p < 0.05; Δ, p > 0.05, one-way ANOVA. con, control.

