FIGURE 3.
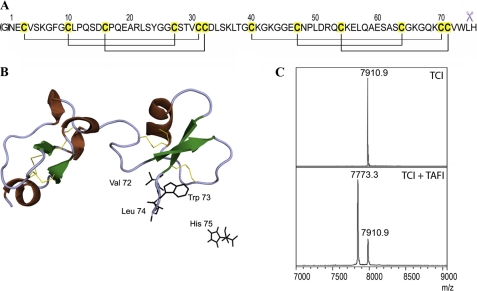
TAFI cleavage of TCI. TCI comprises 75 residues and six disulfide bonds (panel A). The cleavage of its C-terminal amino acid residue after interaction with A/B carboxypeptidases is indicated by scissors. The N-terminal glycine shown in brackets is the consequence of the heterologous expression system used. Richardson plot of TCI shows its two highly structural homologous domains and the secondary structure elements (ribbons for the concatenated 1,4-turns and the α-helix, arrows for the β-strands) (panel B). The disulfide bonds are shown as yellow sticks. The last residues of the C-terminal tail are shown as black sticks, with His-75 cleaved off after protease interaction. MALDI-TOF MS analysis of TCI shows a single peak in the spectrum, with a mass of 7910.9 Da corresponding to the intact inhibitor (panel C). When TAFI was incubated with TCI at equimolar concentration for 20 min, the products analyzed by MS clearly showed a C-terminally cleaved inhibitor with a mass of 7773.7 Da.

