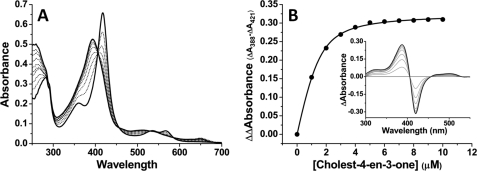
FIGURE 2.
Spectral binding of cholest-4-en-3-one to CYP142. A shows absolute spectra recorded during titration of CYP142 (4.8 μm) with cholest-4-en-3-one. The Soret band shifts from 418 to 393 nm as the HS ferric heme iron form accumulates. The development of a charge-transfer species at 649 nm is further confirmatory of the substrate-like nature of the binding event. B shows overlaid difference spectra from the titration shown in A, and cholest-4-en-3-one-induced absorption change plotted versus cholest-4-en-3-one concentration, with data fitted using Equation 1 to produce a Kd value of 0.36 ± 0.04 μm.

