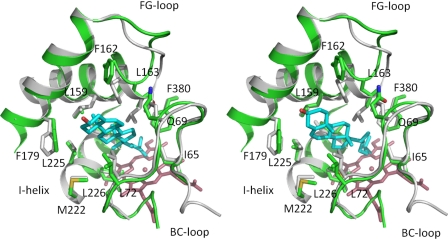
FIGURE 8.
Models of the CYP142:cholesterol complex. An overlay of the active site of the CYP142 crystal structure (in gray) with both the modeled cholesterol-CYP142 complexes (green). The images in the left and right panels show the two different docked conformations of cholesterol defined in the modeling studies. Key residues contacting the cholesterol tetracyclic ring are shown in atom colored sticks, with the docked cholesterol molecule depicted in cyan. The largest differences in protein structure occur in the FG-loop region. Both models indicate that the terminal part of the cholesterol side chain approaches the heme iron, consistent with the observed cholesterol 27-oxidation reactions observed for CYP142.

