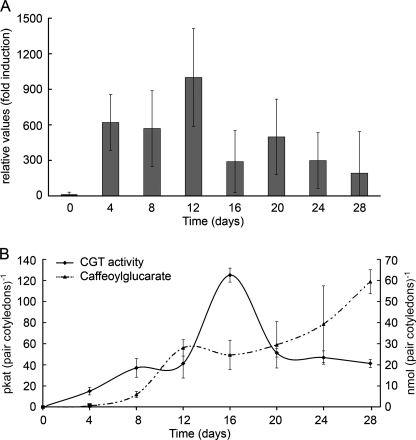
FIGURE 4.
Relative transcript accumulation of SlCGT in developing cotelydons is followed by increasing enzyme activity and product accumulation. A, developing cotelydons of tomato seedlings were harvested at the time points indicated, and total RNA was analyzed by real-time RT-PCR. SlCGT transcript levels were normalized to SlEF1α levels, the lowest value (seeds) was set to 1. B, time course of changes in enzyme activity of SlCGT and accumulation of 2-O-caffeoylglucaric acid as one of the two isomeric structures (2-O- or 5-O-isomer). Data represent the mean ± S.D. (N ≥ 3) and are calculated on the basis of one pair of cotyledons.

