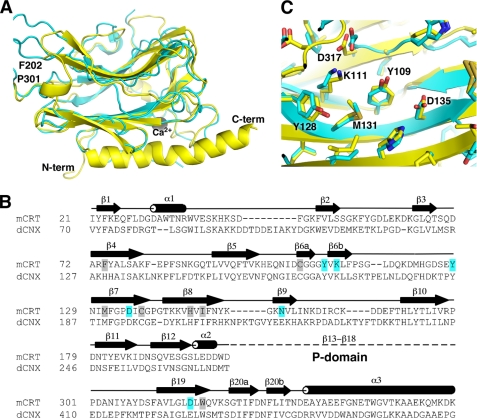
FIGURE 4.
Structural comparison of the CRT and CNX lectin domains. A, overlay of the CRT (yellow) and CNX (Protein Data Bank code 1JHN; cyan) structures. The termini and boundaries of the P-domain of CRT are indicated. B, structure-based sequence alignment of mouse CRT and dog CNX lectin domains. Secondary structure of CRT is shown above the alignment with β-strands and α-helices labeled. Residues that make direct hydrogen bonds with Glc1Man3 are highlighted in cyan, and those making van der Waals contacts are highlighted in gray. The position of the internal P-domain comprising strands β13 to β18 of CRT is indicated. C, enlarged view of the carbohydrate-binding site shows nearly identical positioning of key residues in CRT and CNX. Residue numbers refer to CRT. N-term, N terminus; C-term, C terminus.

