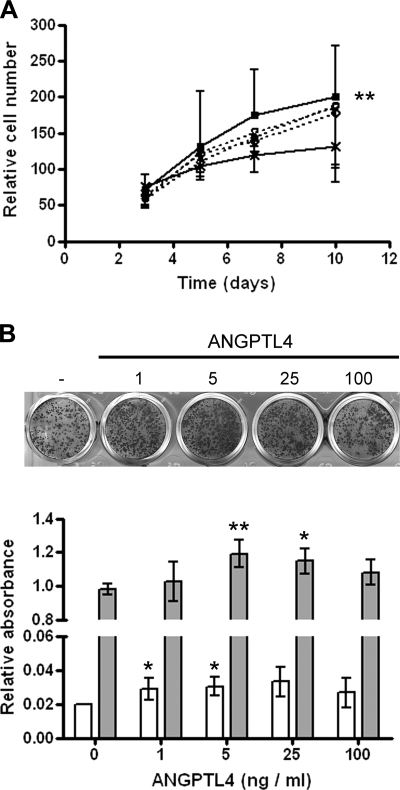
Figure 8.
ANGPTL4 and the osteoblastic phenotype. A) Proliferation of Saos2 cells over a 10-d period in the presence of 1–100 ng/ml ANGPTL4. ANGPTL4 at 100 ng/ml (■——■) induced significant osteoblast proliferation compared with the untreated control (×——×). ○– – –○, 1 ng/ml ANGPTL4; ▵– – –▵, 5 ng/ml ANGPTL4; ◊– – –◊, 25 ng/ml ANGPTL4. **P < 0.01 vs. untreated control. B) Visualization of Saos2 mineralization with Alizarin red. Quantification at d 7 (open bars) and d 14 (shaded bars) showed the most significant effect at 5 ng/ml ANGPTL4. *P < 0.05, **P < 0.01 vs. no ANGPTL4 control.

