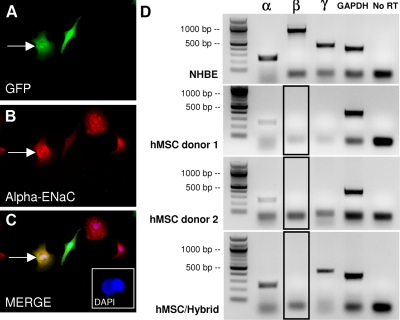
Figure 3.
ENaC expression in NHBEs, hMSCs, and hMSC/NHBE hybrid cells. A–C) GFP-positive heterokaryon expressing α-ENaC (red). Note that unfused hMSC (fibroblastic) also expresses a low level of α-ENaC. Inset: DAPI staining showing 2 nuclei in fused cell. D) Top panel: control NHBE cells express robust levels of α-, β-, and γ-ENaC. Middle panels: hMSCs express α-ENAC before coculture (2 donors shown) but not β-ENaC or γ-ENaC. Note that α-ENaC mRNA expressed by hMSCs was confirmed by cDNA sequencing. Bottom panel: hybrid cells express α- and γ- but not β-ENaC. Boxes with black outline indicate the lane where a β-ENaC band is not present (compare with NHBE β-ENaC band above). GAPDH and No RT are positive and negative controls.

