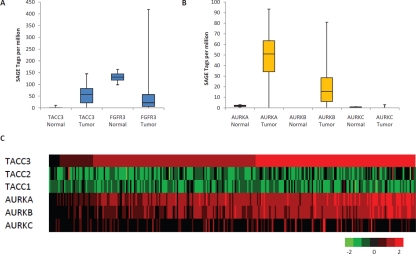
Figure 6: TACC3 is the predominant gene upregulated in 4p16.3 and correlates with Aurora kinase expression.
SAGE of (A) TACC3 and FGFR3 and (B) Aurora kinases, AURKA, AURKB, and AURKC in normal brain (n = 2) and glioblastoma (n = 16) samples (data adapted from [5]). (C) Gene expression of TACC and Aurora kinase family members using the TCGA glioblastoma expression data set (n = 266) indicates correlation between TACC3 and AURKA (correlation coefficient = 0.76) and between TACC3 and AURKB (correlation coefficient = 0.70). Red indicates high gene expression level and green indicates low gene expression level.

