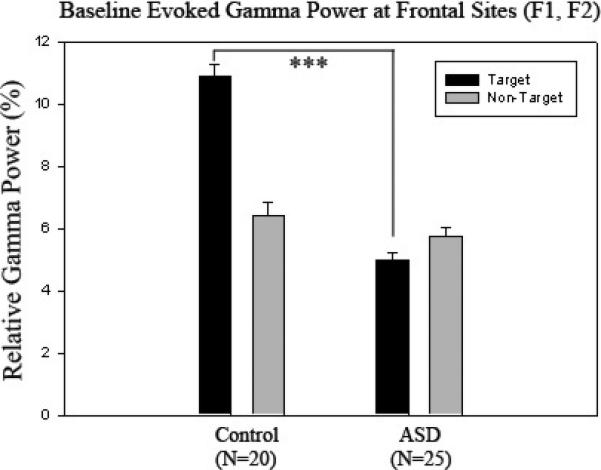
Figure 3.

Relative evoked gamma power at frontal sites (F1, F2) in control (N=20) and ASD groups (N=25) to target and non-target stimuli. Controls have significantly higher evoked gamma power to target Kanizsa stimuli compared to the ASD group (p < .001) with more of a pronounced difference between target and non-target stimuli.
