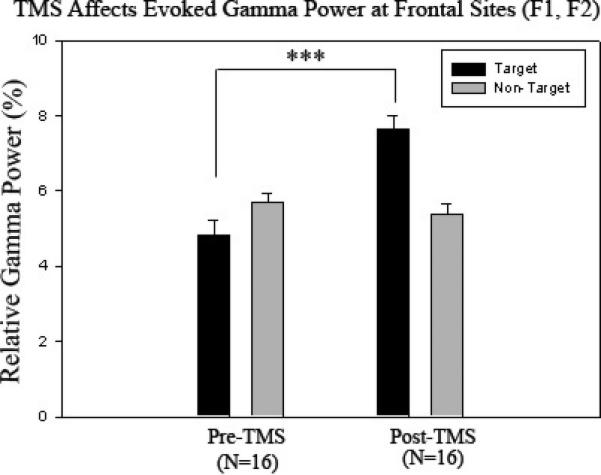
Figure 4.

Relative evoked gamma power at frontal sites (F1, F2) in Pre-TMS (N=16) and Post-TMS groups (N=16) to target and non-target stimuli. Relative evoked gamma power significantly increases to target stimuli (p < .001) with more of a pronounced difference between target and non-target stimuli as a result of rTMS.
