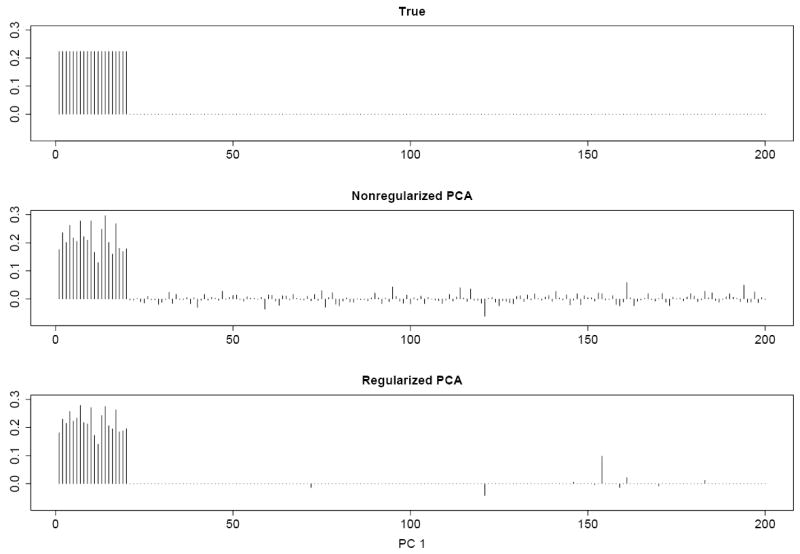
Fig 1.

A simulated data set with n = 100, d = 200, and k = 1. Top, middle and bottom panels show respectively the true loadings, loadings from the nonregularized logistic PCA and from the regularized logistic PCA. The penalty parameter is selected using the BIC.
