Fig 2.

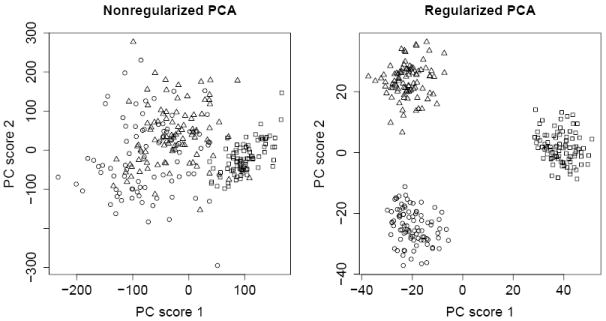
The scatterplots of the first two PC scores from the nonregularized (left) and regularized logistic PCA. Circle, rectangle and triangle represent Caucasian, African and Asian population respectively.

The scatterplots of the first two PC scores from the nonregularized (left) and regularized logistic PCA. Circle, rectangle and triangle represent Caucasian, African and Asian population respectively.