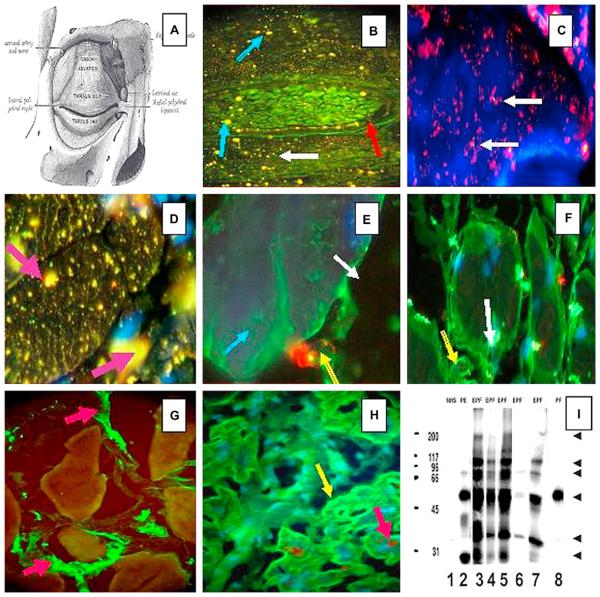
Fig 3.
A, A diagram of the eye superior tarsal muscle (musculus tarsalis superior) showing a panoramic view of a tarsal plaque. (Reprinted from Gray H. Gray's Anatomy of the Human Body. 20th ed. Philadelphia: Lea & Febiger;1918.) B, Direct IF shows a panoramic view of a tarsal plaque with small continuously yellow-greenish dots around the plaque (red arrow). In addition to this, reactivity to larger dots (blue arrows) and smaller ones (white arrow) was observed. These findings were seen using a secondary goat antihuman IgG/IgA/IgM antiserum conjugated with FITC. C, Positive red dots, seen in bundles of tarsal muscle, using antihuman IgG antiserum conjugated with Alexa Fluor 594 (white arrows). D, Using conjugated antihuman IgG Alexa 488 (yellow stains dots), larger bundles of tarsal muscle show positive reactivity of different shapes inside the myocytes (purple arrows). In this case, the reactivity was seen with antihuman fibrinogen FITC conjugate. In addition, thin zig-zag yellowish positivity was seen inside the muscle bundles resembling the staining of sarcoplasmic structures. E, When repeating the experiments using antihuman fibrinogen FITC conjugate alone, the staining shows a positive reactivity outside the myocytes, as seen at higher magnification (green staining) (blue arrow). In addition, there is a structure that resembles a “large-cell junction” (red staining)(yellow arrow) using antihuman IgM antiserum conjugated with rhodamine. The white arrow indicates the extracellular space. F, The white arrow shows autoreactivity to a large structure inside the myocytes using antihuman IgG FITC conjugated. The yellow arrow shows autoreactivity to the plasma membrane. G, We performed IIF testing on heart muscle tissue from sheep, beef, rat, and human, to determine if the reactivity could be observed in multiple species. Positive staining was noted among the muscle bundles (green staining) utilizing FITC conjugated antihuman fibrinogen (red arrows). This staining was noted when rabbit antihuman fibrinogen and albumin antisera were used. H, We used tissue microarray slides as the antigen source with Alexa 488 conjugated and antihuman IgG heavy and light chain (H&L) antiserum. We again showed positivity within muscle bundles (green staining)(yellow arrow). To identify colocalization with the autoreactivity detected by antihuman IgG for gap junctions, we used an antibody to connexin-43 as a control (brown staining)(red arrow). However, the autoreactivity did not superimpose with connexin-43, although confocal microscopy was not performed. (Note that in D, E, F, and H, the cell nuclei were counterstained with DAPI [blue]). I, The sera were tested by IP, and an approximately 45 kDa protein band was strongly recognized by sera with numbers 2, 3, 4, 5, and 7 (and very weakly by number 8). In addition to this band, other antigenic bands were immunoprecipitated, mostly by the El Bagre-EPF patient sera (numbers 2, 3, 4, 5, 7). As a control, we also used normal human serum (NHS) (Lane 1). Lanes 3 to 7 correspond to sera from El Bagre-EPF patients, and lane 8 corresponds to serum from a sporadic PF patient. The molecular weight marker standards are shown in the first lane on the left (200, 117, 96, 66, 45, and 31 kDa, respectively). The arrows on the right point to protein bands of approximately 200, 117, 89, 67 and 34 kDa that were consistently recognized by the El Bagre-EPF sera, and to lesser extent, by the sera from patients with pemphigus erythematosus. Although we show the results of 7 sera, all 12 sera showed similar results.

