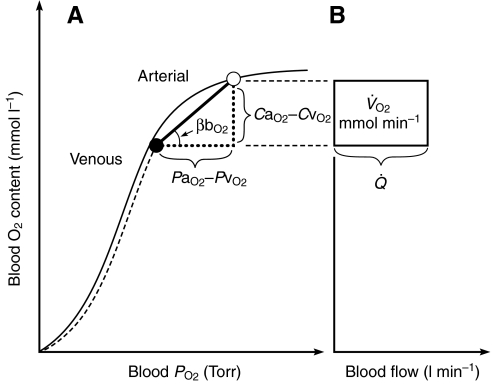
Fig. 3.
Schematic illustration of blood O2 transport. (A) O2-equilibrium curve under physiochemical conditions prevailing in arterial blood (a, solid curve, open symbol) and venous blood (v, dashed curve, closed symbol). The x-axis measures blood PO2 and the y-axis measures blood O2 content. CaO2–CvO2 denotes the arterial–venous difference in O2 content, PaO2–PvO2, denotes the corresponding difference in PO2, βbO2 denotes the blood O2 capacitance coefficient (see text for details),  denotes cardiac output, and
  denotes the rate of O2 consumption. (B) The area of the rectangle is proportional to total O2 consumption, which can be enhanced by increasing
  and/or by increasing the βbO2. Increases in the βbO2 produce a corresponding increase in CaO2–CvO2 through shifts in the shape or position of the O2-equilibrium curve.

