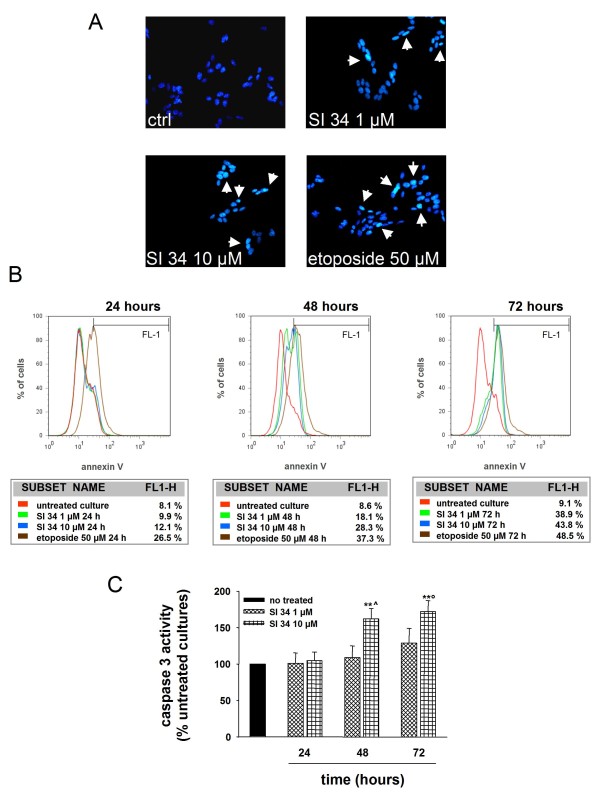
Figure 4.
Evaluation of apoptosis induced by SI 34 on SH-SY5Y cells. (A) Morphological analysis of nuclear chromatin in SH-SY5Y cells stained with the DNA-binding fluorochrome Hoechst 33258. Cells with morphological changes in the nuclei or condensed chromatin were defined as apoptotic cells. Arrows point the intense nuclear fluorescence present in some cells exposed to both SI 34 (1 and 10 μM) or etoposide (50 μM). Nuclei were visualized by fluorescence microscopy at a magnification of 200×. A representative experiment that was replicated three times with similar results is shown. (B) Annexin V (FITC) staining assay. SH-SY5Y cells undergoing apoptosis were detected by cytofluorimetric analysis as described in materials and methods. Values reported depicted the percentage of events within the gate FL1 used to define AnV+ cells. The red line represents the untreated culture. The green and blue lines symbolize the cells incubated with SI 34 1 and 10 μM, respectively. The brown curve embodies SH-SY5Y cells exposed to etoposide 50 μM as inducer of apoptosis. The FACS analysis shown is representative of three different experiments. (C) Caspase-3 activity assay performed as described in the materials and methods. Results are expressed as percentage of relative fluorescence units (RFU) per min per mg of protein detected in untreated cultures, which are arbitrarily expressed as 100%. Each value represents the mean ± S.E.M of three sets of experiments performed in triplicate. **P < 0.01 vs respective control; ^P < 0.01 vs 48 hours SI 34 1 μM; °P < 0.05 vs 72 hours SI 34 1 μM.

