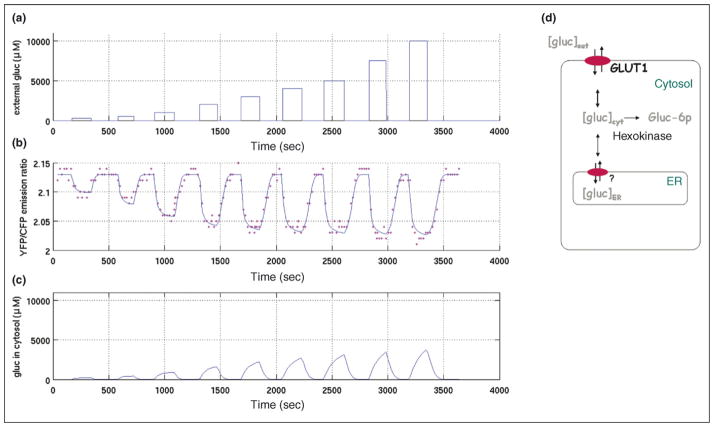
Figure 3.
Changes in glucose concentration in HepG2 cells stably expressing FLIPglu600 μ. (a) External perfused glucose concentration. (b) Measured yellow fluorescent protein (YFP)/cyan fluorescent protein (CFP) emission ratios and simulation curve based on a kinetic model. (c) Cytosolic glucose concentration from simulation. (d) Underlying compartment model for analysis of glucose homeostasis in HepG2 cells (modified from Fehr et al. [31••]). Glucose is transported reversibly across the plasma and ER membranes and is phosphorylated irreversibly in the cytosol.

