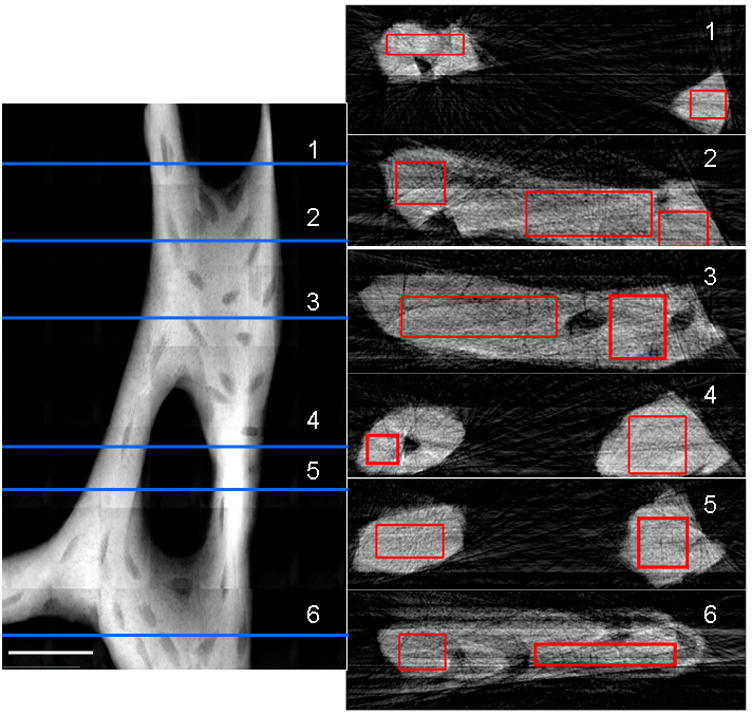
Fig. 6.

TXM 2D mosaic absorption (ln(I0/I)) image of trabecula from mouse tibia at 5.4 keV (left side). Trabecula was imaged every 5 degrees from −90 to 90 degrees to determine 3D geometry. Scale bar is 25 μm. Numbered slices (1–6) reconstructed at horizontal lines on the left are depicted on the right. Average attenuation values determined for the rectangular regions on the slices were 300–365 cm−1 in plate-like regions and 345–370 cm−1 in rod-like trabecular regions, or 44–53% and 51–54% of rod-like crystalline chlorapatite, respectively. Figure reproduced from Andrews et al. Micros. Microanal. (2010) 16: 327-336.
