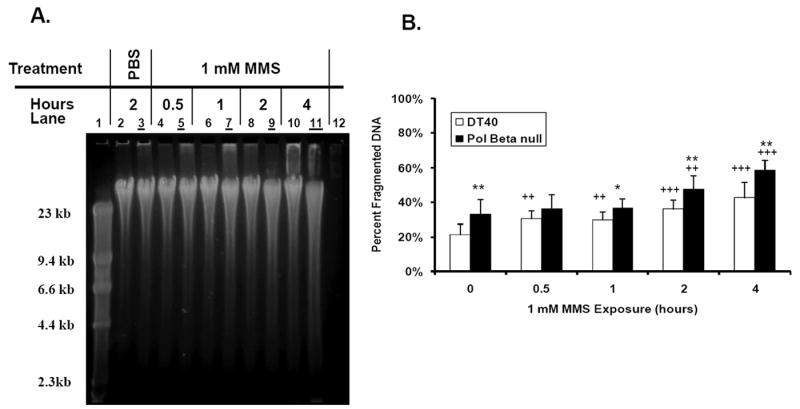
Figure 3. SSB detection in DT40 and Pol β-null cells exposed continuously to 1 mM MMS for up to 4 hours.

(A) Visualization of SSB formation in the cell lines through OTX-coupled AGE analysis. Images obtained using SYBR Gold and the Kodak Image Station 440CF system. Even lanes - DT40 cells; Odd lanes (with underline) - Pol β-null cells; Lane 1 - Marker; Lanes 2-3 – PBS control; Lanes 4-11 - 1 mM MMS exposure for 0.5-4 hours; Lane 12 - Blank. (B) Graphic representation of fragmented DNA in each sample as determined by the AlphaEaseFC gel documentation software. The mean values represent four independent measurements. Bars indicate SD. Statistical significance: ++ p < 0.01, +++ p < 0.001, compared to PBS control of the cell line; * p < 0.05, ** p < 0.01, compared to the corresponding treatment in the wild-type cell line.
