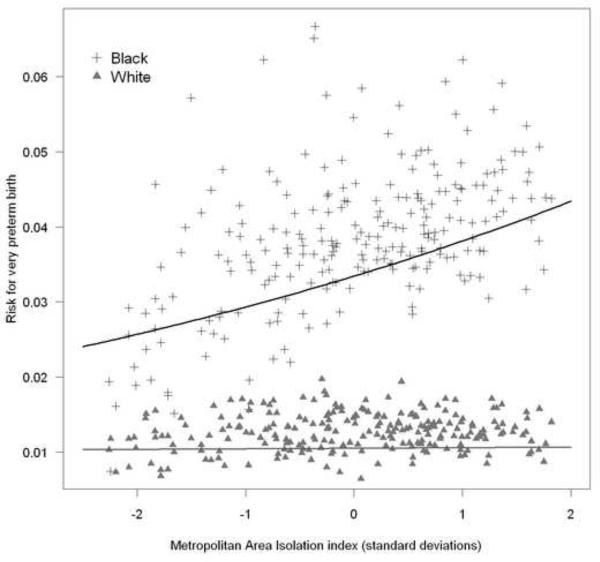
Figure 1. Metropolitan area very preterm birth risk by isolation segregation for black and white women.
Symbols (cross and triangles) represent observed risk for VPT birth in each of 231 MSA's for black and white women respectively; lines represent model predicted risk for VPT birth from Table 2, Model M5.

