
Figure 1. Structured spontaneous activity in auditory cortex.
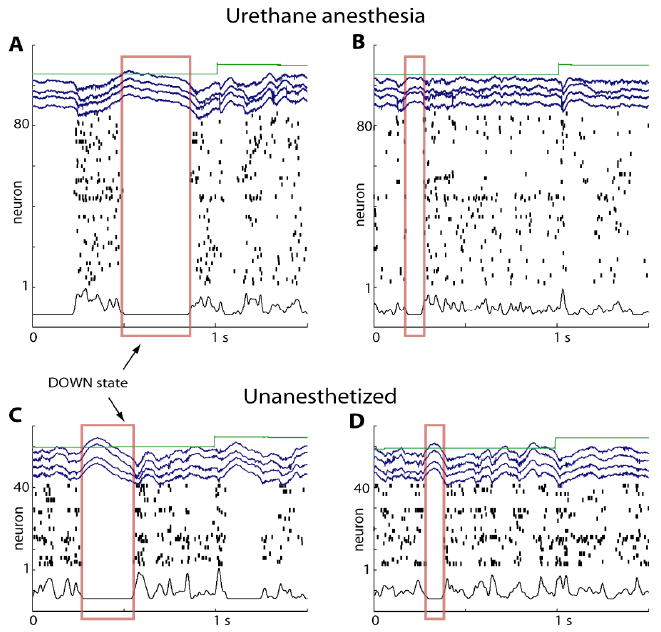
Raster plots show activity of simultaneously recorded layer 5 neurons, blue traces show local field potentials (LFP) recorded from the a subset of the channels from which spikes were detected. Bottom black trace indicates multiunit activity (MUA), i.e. the population-averaged firing rate of all recorded cells. Red rectangles indicate “downstates,” i.e. periods of global network silence. Green traces show sync pulses, with positive values indicating times of tone presentation. (A, B) show two periods from a single recording under urethane anesthesia, (C, D) show two periods in a passively listening unanesthetized animal. Note that structured population activity is seen in all cases, but that the nature of this activity (such as the length of downstates) is variable both between and within recordings. Adapted from Luczak et al (2009).