
Figure 2. Sequential population activity patterns.
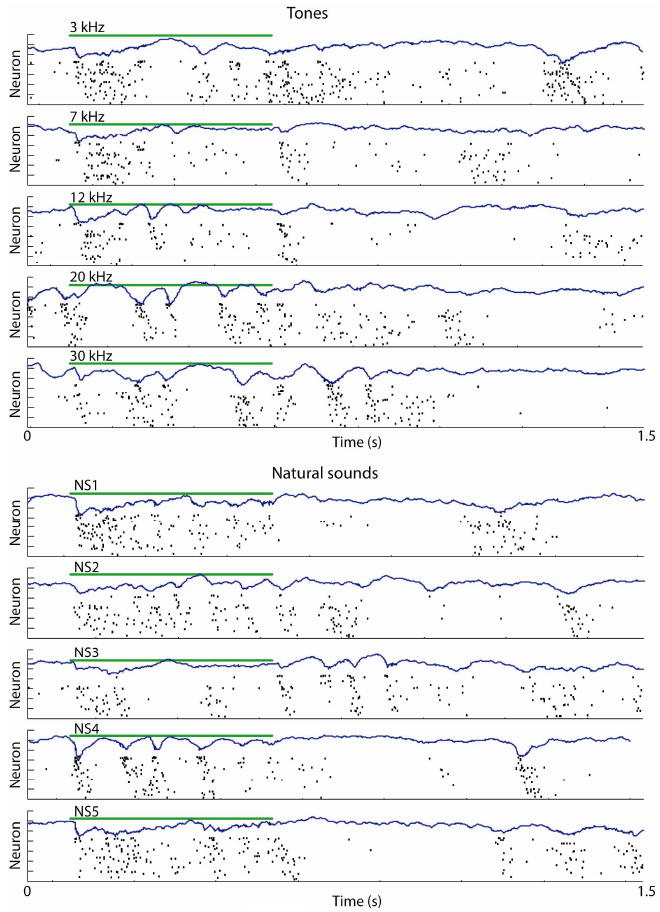
Representative raw data plots, showing responses to five tones (3, 7, 12, 20, 30 kHz respectively) and five different natural sounds (insect vocalizations), together with spontaneous activity patterns seen after stimulus offset, taken from a single recording under urethane. The green line indicates the duration of the stimulus; blue traces show local field potentials from one of the recording sites; underneath is a raster plot showing the spike trains of simultaneously recorded neurons. Neurons are sorted vertically by average spontaneous mean spike latency to reveal sequential firing patterns (unlike Figure 1, where they were arranged by recording shank). Neurons are displayed in the same vertical order in all plots. Although population firing events can vary significantly in firing rate and duration, stereotyped sequential patterns of timescale ∼100ms typically accompany evoked and spontaneous population spiking events, as well as occurring during the presentation of extended tones and natural sounds. Adapted from Luczak et al (2009).