
Figure 3. Preservation of sequential structure between sensory-evoked and spontaneous events in unanesthetized animals.
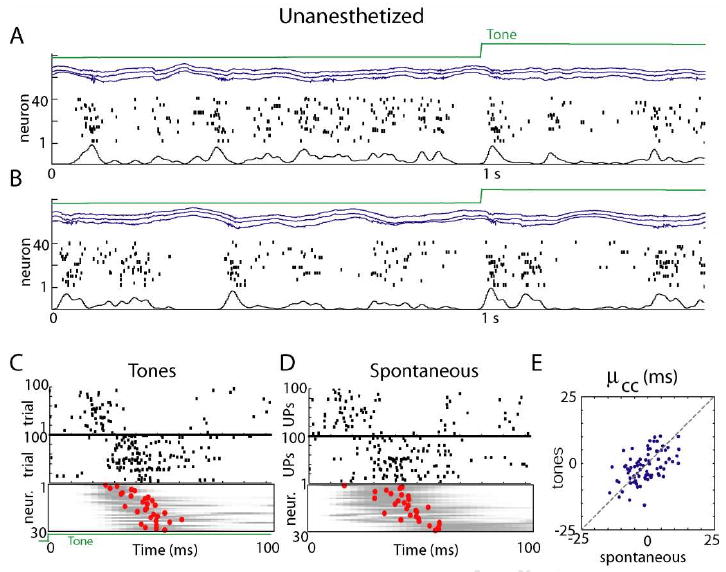
(A, B) Representative raw data plots from an unanesthetized, head-fixed subject in a passive listening paradigm. (C,D) Top two rasters (black ticks) show spike times for two individual neurons, triggered by tone onsets (C) and upstate onsets (D). Bottom panels show average activity of all simultaneously recorded neurons triggered by tone or upstate onsets: grey bars show pseudocolor representations of each neuron's perievent time histogram (PETH), red dots denote each neuron's mean spike latency in the 100ms after tone onset. Neurons are ordered vertically by the mean latency over all stimuli, to illustrate sequential spread of activity. Neurons are sorted in the same order in C and D, to illustrate the similar sequential order of tone-evoked and spontaneous activity. (E) Conservation of latency measure μcc across tones and spontaneous events. Adapted from Luczak et al (2009).