
Figure 5. Visualization of population firing rate vectors.
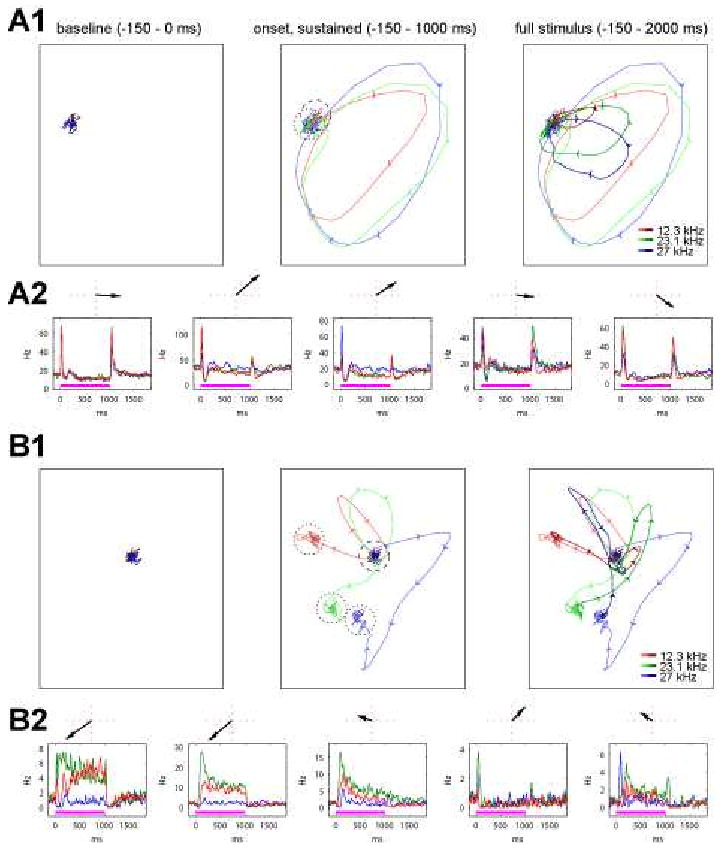
The panels show projections of the mean firing rate vector trajectory of 282 cells pooled from 4 experiments, evoked by tones of three frequencies, plotted for increasingly longer time periods from left to right. (A1) Trajectories viewed with principal component analysis (PCA), which finds the projection of maximum variance; all three plots are in the same projection. In this projection, onset responses are dominant. (A2) PSTHs of the five cells contributing most to the PCA projection. Arrows above each PSTH indicate factor loadings in the projections above. (B1) Trajectories viewed with multiple discriminant analysis (MDA), to maximize the differences between sustained responses. In this projection, onset, sustained, and offset responses have approximately equal magnitude. Dashed circles: baseline activity, dotted circles: sustained activity. (B2) PSTHs of the five cells contributing most to the MDA projection. Arrows as in A2. Adapted from Bartho et al (2009).