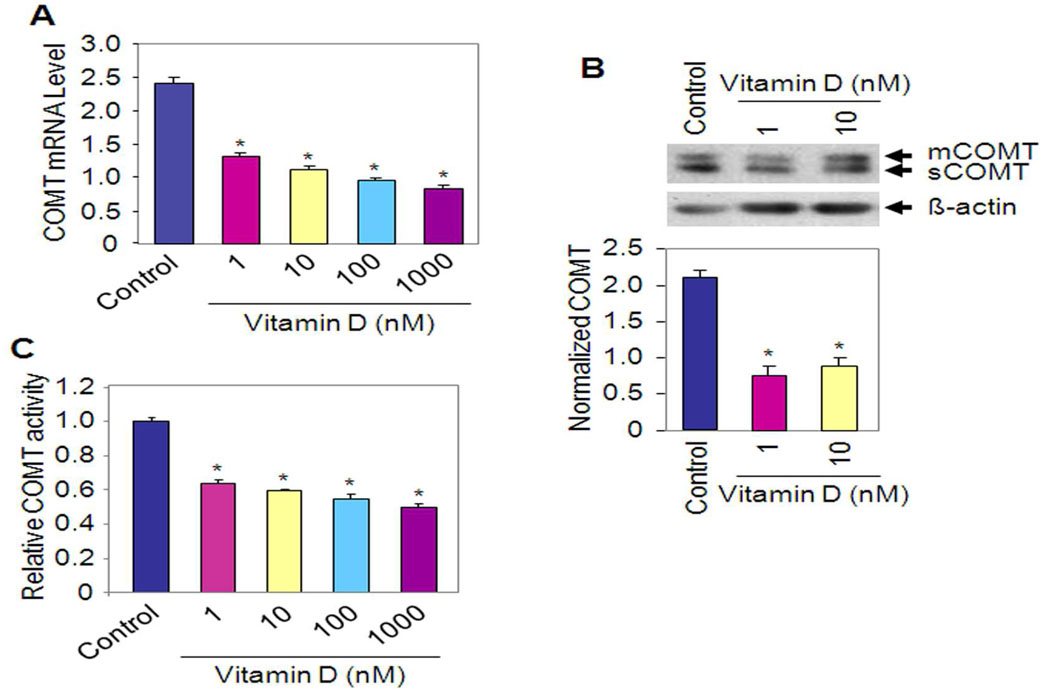
Figure 3. Effect of Vitamin D on COMT mRNA and protein expression, and enzyme activity.
(A) Quantitative analysis of COMT mRNA expression levels with real time RT-PCR after treatment of HuLM cells with different doses of Vitamin D (1 nM to 1 µM) for 48 h. Expression levels of COMT mRNA are shown as the mean ratio of target-to-reference gene ± SE relative to the vehicle-treated control. Results are expressed as mean ± SE of three independent experiments. *P < 0.05 compared to untreated control. (B) HuLM cells were treated with Vitamin D for 48 h and cell lysates were prepared and analyzed by western blotting with anti-COMT antibody. The intensity of each protein signal was quantified and normalized with corresponding β-actin. *P < 0.05 compared to untreated control. (C) COMT enzyme activity was assayed after the treatment of HuLM cells with different doses of Vitamin D as indicated. COMT enzyme activity was expressed in units per milligram of total protein. *P < 0.05 compared to untreated control.

