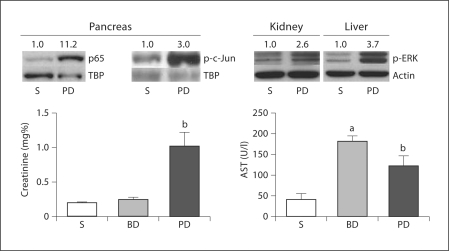
Fig. 5.
Immunoblots of pancreatic nuclear fractions show increased expression of p65 and p-c-Jun as soon as 1 h after PD ligation, compared to sham (S). Immunoblots of kidney and liver cytosolic fractions show ERK activation as soon as 1 h after PD ligation, compared to sham. Densitometry ratios normalized to nuclear loading controls (TBP = TATA binding protein) are provided above each immunoblot lane with the sham control value represented as 1. Graphs show plasma creatinine and AST concentrations after 48 h in sham, BD ligation and PD ligation groups. Data are means ± SEM; a p < 0.05 vs. sham; b p < 0.05 vs. sham and BD ligation; ANOVA; n ≥ 10/group.

