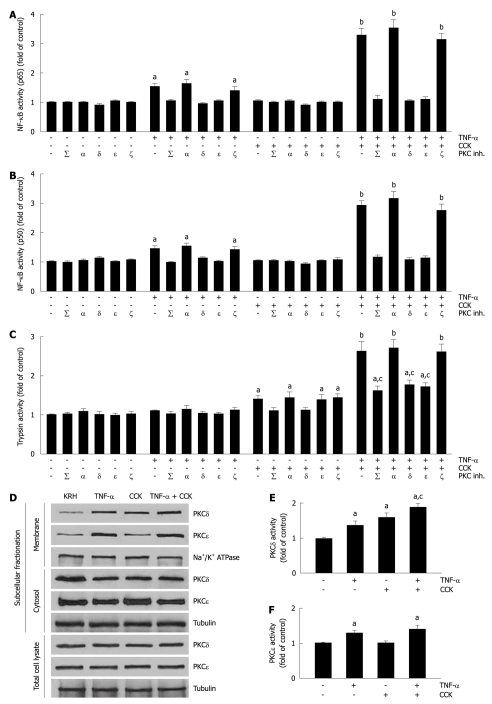
Figure 2.
Mutual modulation of tumor necrosis factor-α-induced activation of nuclear factor-κB and cholecystokinin-induced trypsin activity by submaximal cholecystokinin and tumor necrosis factor-α, respectively, involves specific protein kinase C isoforms δ and ε. A-C: Isolated pancreatic acini were incubated in Krebs-Ringer-HEPES (KRH) (vehicle-control, 3 h), or in KRH (2.5 h) followed by Calphostin C (iPKCΣ, 500 nmol/L, 30 min) or Gö6976 (iPKCα, 200 nmol/L, 30 min), or with the PKCδ translocation inhibitor δV1-1 (iPKCδ, 3 h, 10 μmol/L) or the PKCε translocation inhibitor εV1-2 (iPKCε, 3 h, 10 μmol/L) or the PKCζ myristoylated pseudosubstrate inhibitor (iPKCζ, 3 h, 10 μmol/L). The acini were then stimulated with either 10 ng/mL tumor necrosis factor-α (TNF-α) for 2 h, or 50 pmol/L cholecystokinin (CCK) for 1 h, or 10 ng/mL TNF-α for 1 h followed by 10 ng/mL TNF-α plus 50 pmol/L CCK for 1 h, or KRH for 2 h. Nuclear factor-κB (NF-κB) (p65) and NF-κB (p50) in nuclear extracts (A and B) were measured by enzyme-linked immunosorbent assay (ELISA) using the respective assay kit. Trypsin activity (C) was measured as described in Materials and Methods. A-C: Results are expressed as fold of control and correspond to the mean ± SE from four independent experiments, with samples performed in triplicate. aP < 0.05, bP < 0.01 vs KRH without inhibitors; cP < 0.05 vs TNF-α plus CCK without inhibitors; D-F: Dispersed acini were pre-incubated in KRH for 1 h and then stimulated with either 10 ng/mL TNF-α for 1.5 h, or 50 pmol/L CCK for 30 min, or 10 ng/mL TNF-α for 1 h followed by 10 ng/mL TNF-α plus 50 pmol/L CCK for 30 min, or KRH (vehicle-control) for 1.5 h; D: Subcellular fractionation showing PKCδ and ε translocation from the cytosol to the membrane upon TNF-α and/or CCK stimulation. After stimulation, acini were fractionated into membrane and cytosol fractions, and total cell lysates. 10 μg of protein of each fraction was separated on SDS-PAGE and immunoblotted with the antibodies to the indicated proteins. These blots are representative of three independent experiments; E, F: PKCδ and ε activity assays. Each well was loaded with 10 μg of protein. PKCδ and ε activities were measured by ELISA using the respective assay kit. Results are expressed as fold of control and correspond to the mean ± SE from four independent experiments, with samples performed in triplicate. aP < 0.05 vs vehicle-control; cP < 0.05 vs either TNF-α or CCK.

