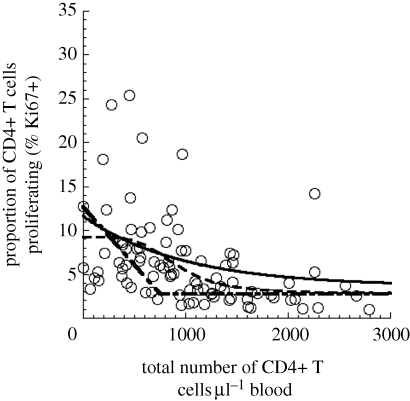
Figure 5.
Functions used to describe the relationship between CD4+ T cell number and proliferation level: Using the data points for RMs as an example, the simple exponential (solid line), Hill function (dashed line) and piecewise linear (dashed-dotted line) functions were fitted to describe the relationship between CD4+ T cell number and proliferation level. However, the same divergent behaviour between pathogenic and non-pathogenic infection is observed regardless of the form of the functions used in the model.

